The INGEBYRA PULSE STORM 

NEW SOUTH WALES   AUSTRALIA

2nd January 2004

Analysis: Clyve Herbert (ASWA Victoria)

Images: Robert Alexander (Wodonga, Victoria)
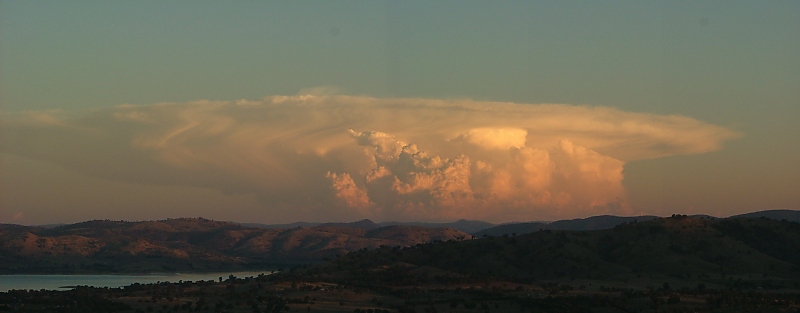
Looking from near Wodonga

Figure 1...The Ingebyra pulse storm photographed from just east of Wodonga, showing its massive and organised scale complete with a strong backsheared anvil and the main anvil streaming off to the northeast (~1945AEST)
  Image � Robert Alexander

 
ABSTRACT
Between approximately 1900hrs and 2100hrs on the 2/1/2004, a peculiar and severe thunderstorm developed to the southwest of Dalgety New South Wales within the Southern Tablelands region (Snowy Mountains). It was the only storm to develop in this region on the day and from photographic evidence appeared to have become severe between 1940hrs and 2010hrs with a peak intensity at around 1950hrs (AEST).   A feature of the storm were intense updrafts and overshoots and a prominent backsheared anvil - upper flow at 300hPa was from approximately 255 degrees (to be confirmed). Analysis of available satellite imagery shows what appears to be a convective line associated with a possible converging seabreeze front in this area moving into the region from the east. The geographical set up of this region has the high Kosciusko ranges to the north and the Victorian Alps to the west. The Dalgety area is also rather dry (mean annual  rainfall 476mm) and exhibits a classical rainshadow locality, however although the region is elevated between 600m and 800m, there are large rather flat to undulating areas. The region can also be a 'Hotspot' under the right synoptic set up as on the 2nd January 2004.


Figure 2... The Ingebyra storm produced  several powerful overshoots at its peak intensity...

  Image � Robert Alexander


Figure 3...detail of the main updraft showing very strong convection on the west flank (~2020hrs) Image � Robert Alexander


Figure 4...   Image � Robert Alexander


Figure 5...  Image � Robert Alexander

Satellite images, charts & observations


SATELLITE ANALYSIS
The black and white GOES loop is interesting.... after approximately 1700hrs, a line of low level cumulus can be seen propagating west-northwest across the southern regions of the Southern Tablelands, and appears to be a possible sea breeze associated surge -  this line pushes west to near the Victorian border at about 1830 hrs (approximately). The first stronger scale convective development is an isolated and prominent updraft at about 1900hrs -  the convective pulse then rapidly develops over the next two hours and finally decaying after 2100hrs. The rounded anvil development is a feature of this storm.  In its more severe stage, the storm complex also shows a left move characteristic although this may have been steered by upper west to southwest flow patterns. Other factors to consider from satellite returns are the arrival of what appears to be a southwest surge in the area co-incidentally with the west moving sea breeze. This can be seen within the satellite loop and the sudden appearance of strong convection at this time. This activity together with local enhanced heating may have added additional forcing to the convective capacity of the local environment.

8pm colour IR image

Figure 5...

9pm colour IR image

Figure 6...

10pm colour IR image

Figure 7...

Click this image to get the SE Australia IR animation

Figure 8...IR loop SE Australia - loop loads automatically

RADAR DISCUSSION
The first detected radar activity were weak echoes at around 1920hrs AEST - returns rapidly intensified after this time with maximum reflectivity around 1950hrs. The storm appears to have remained strong over the next 30 minutes or so - radar shows a definite shift of the primary updraft to the left of the steering mid level flow over this time. The storm weakened rapidly after about 2020 hrs and dissipated thereafter.

Click this image to get the radar loop 256k Captains Flat

Figure 9...Radar loop - Captains Flat (Canberra) 256k (click for loop)

SYNOPTIC SITUATION
The local synoptic conditions showed a trough extending from southwest Queensland to near Albury at 1600hrs, a marked lower level northeast sea breeze was operating along the southeast coast of New South Wales - it is apparent that an extension of the inland trough extending from southwest Queensland to the Snowy Mountains are may have developed a local 'heat' trough through the ACT to terminate near to Bombala at 1700 hrs.

Streamline analysis shows a rather small are of convergence just northwest of Bombala at around this time. To the west of the region a marked low level southerly flow was apparent extending northward on the west side of a larger scale trough.

Figure 10...4pm 2nd January 2004 synoptic analysis

Figure 11...9pm analysis: surface streamlines, temperature, RH%


CONCLUDING DISCUSSION
The development of isolated and intense storms within the Australian environment is relatively common. Primarily known as 'pulse' storms, a characteristic of such storms are their rapid development and ability to produce brief and sometimes severe weather, including large hail, local severe winds, and even weak tornadoes. Another characteristic and just as astonishing is their ability to decay or collapse very rapidly. Such storms operate in what could be regarded as 'marginal' conditions for storm activity, but despite this, can achieve severe proportions. The Ingebyra storm appears to be a good example of an Australian pulse storm that may have reached severe proportions.... developed rapidly and decayed abruptly.

From analysis of available photographic coverage, radar returns and satellite imagery, and including other data it appears the Ingebyra storm may have been triggered by a combination of forcing.

A...The arrival of a westward moving sea breeze convergence line adding additional low level moisture,

B.. The geographical location of this region providing a 'local ' hot spot of surface convection,

C..The additional arrival of a south to southwest surge at about the time of convective triggering,

D.. also present was a larger scale trough mechanism affecting much of inland New South Wales.

E.. The arrival of an upper trough across the region near to the time of convection.

The analysis of this data and the concluding discussion are the opinion of the author and I welcome the opinion or discussion of all.

Clyve Herbert (ASWA Victoria)

Analysis and discussion - Clyve Herbert. Images - Robert Alexander.

Thanks to the following for information supplied: Bureau of Meteorology, ASWA, Weatherzone, Laurier Williams and Australian Weather News, James Cook University, Robin Land.

Updated 9th January 2004

Back to AUSSKY