![]()
![]()
Leopold Tornado
3rd October 2001
Imagery, analysis & discussion

|
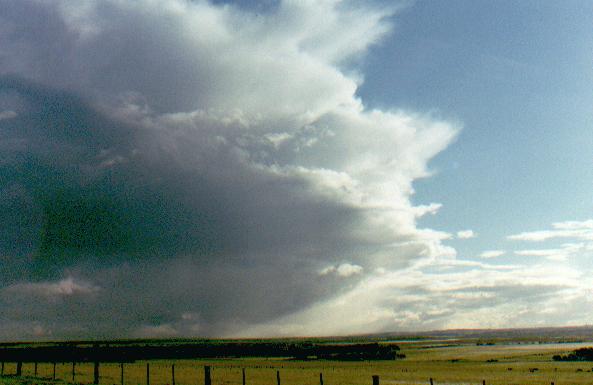
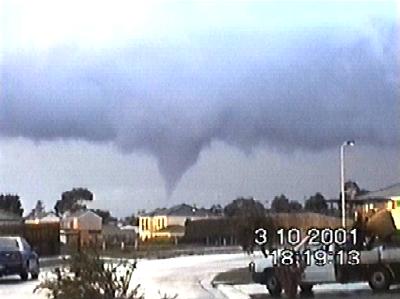
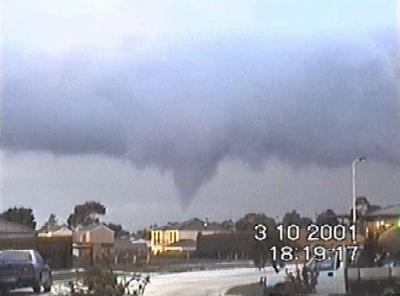
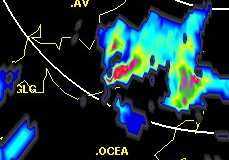
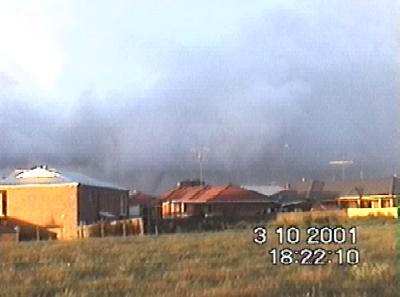
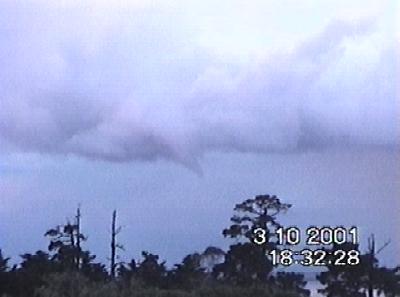
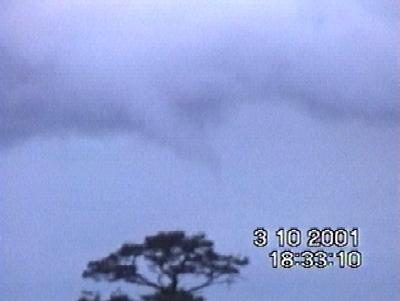
Cold air multicell approaching Leopold - Bellarine Peninsula (1745AEST). The multicell at this time was lightning active. Click on thumbnails below for full sized images & captions on a new page. NB: the first 2 images are different grabs from the same second
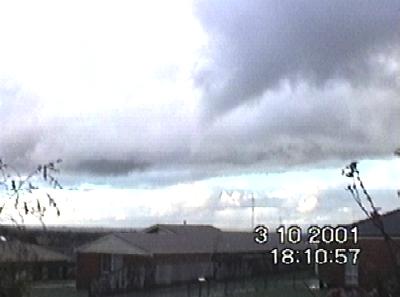
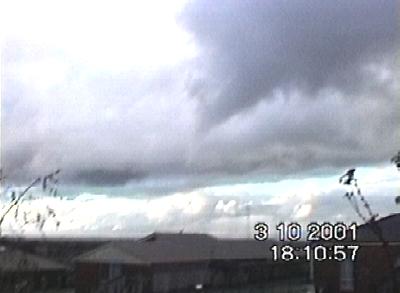
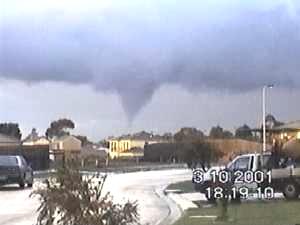
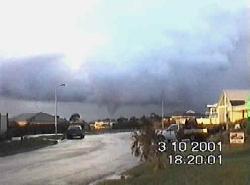
PPI scan (showing very clear hook echo) & video captures, all within 120 seconds of each other: 18:20:01, 18:21:00, 18:22:10.
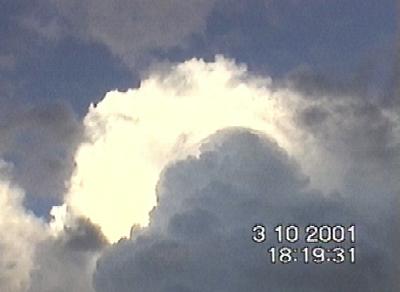
The former Leopold tornadic cell receding over Port Phillip Bay
(1845AEST).
|
||
Click to go to: Leopold Tornado - Discussion, Comments & Analysis Page |
||
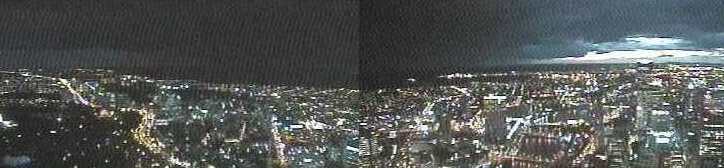
Looking SW from Melbourne CBD - 6.10pm |
||
Looking SW from Melbourne CBD - 6.20pm |
||
Looking SW from Melbourne CBD - 6.30pm |
||
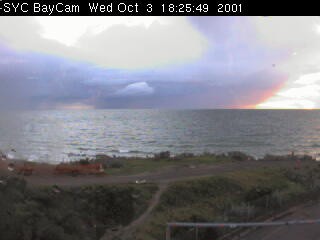 View WSW(ish) from Sandringham Yacht Club |
||
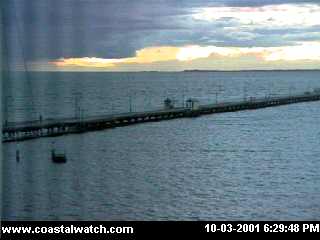 SW from St Kilda - 6.29pm |
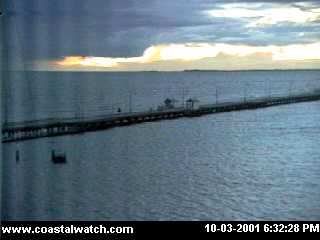 SW from St Kilda - 6.32pm |
 SW from St Kilda - 6.36pm |
 Melbourne 128km radar - 6.20pm |
 Melbourne 128km radar - 6.30pm |
 Melbourne 128km radar - 6.40pm |
 MSL - 4pm |
 AVN analysis 10am |
|
 MSL - 10pm |
 AVN analysis 10pm |
|
 850hPa flow - 3rd Oct 21Z (10am - 4th) |
 850hPa flow - 4th Oct 9Z (10pm) |
 700hPa flow - 3rd Oct 21Z (10am - 4th) |
 700hPa flow - 4th Oct 9Z (10pm) |
 500hPa flow - 3rd Oct 21Z (10am - 4th) |
 500hPa flow - 4th Oct 9Z (10pm) |
 250hPa flow - 3rd Oct 21Z (10am - 4th) |
 250hPa flow - 4th Oct 9Z (10pm) |
|
 500hPa heights & vorticity (7am - 4th)
|
 Front page of the afternoon edition of the Melbourne Herald Sun (4th October 2001) |
 500hPa heights & vorticity (7pm - 4th)
|
 Australian water vapour 0830Z (6.30pm) |
 Geelong Advertiser article 4th October 2001 |
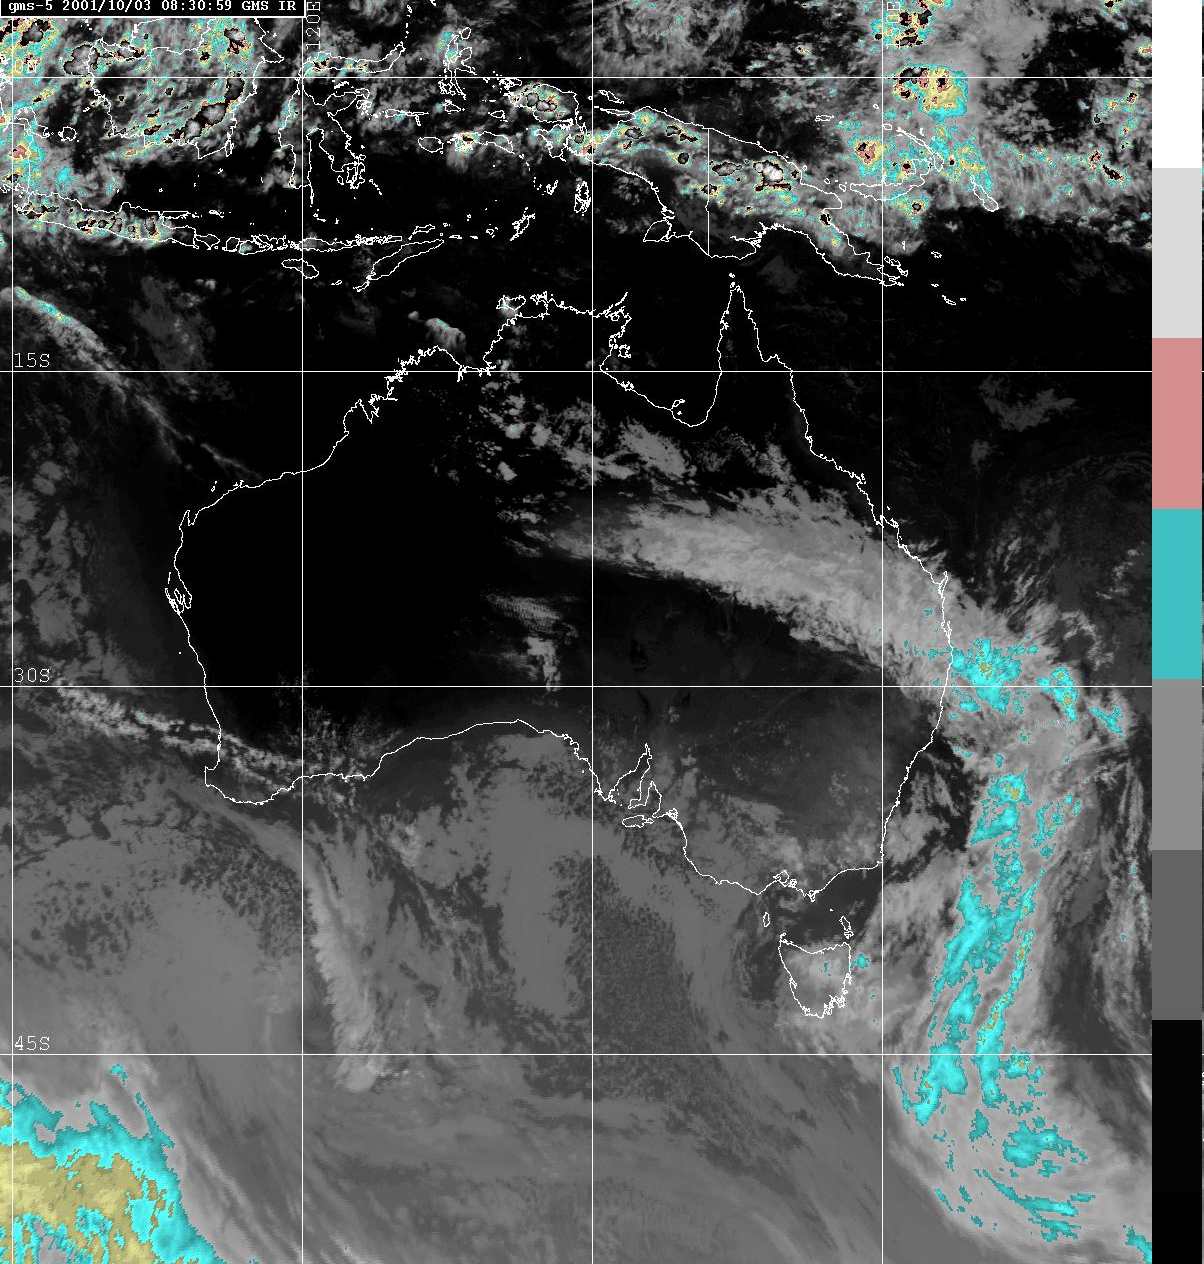 Australian enhanced infra red 0830Z (6.30pm) |
 Vic visible image 11.30am |
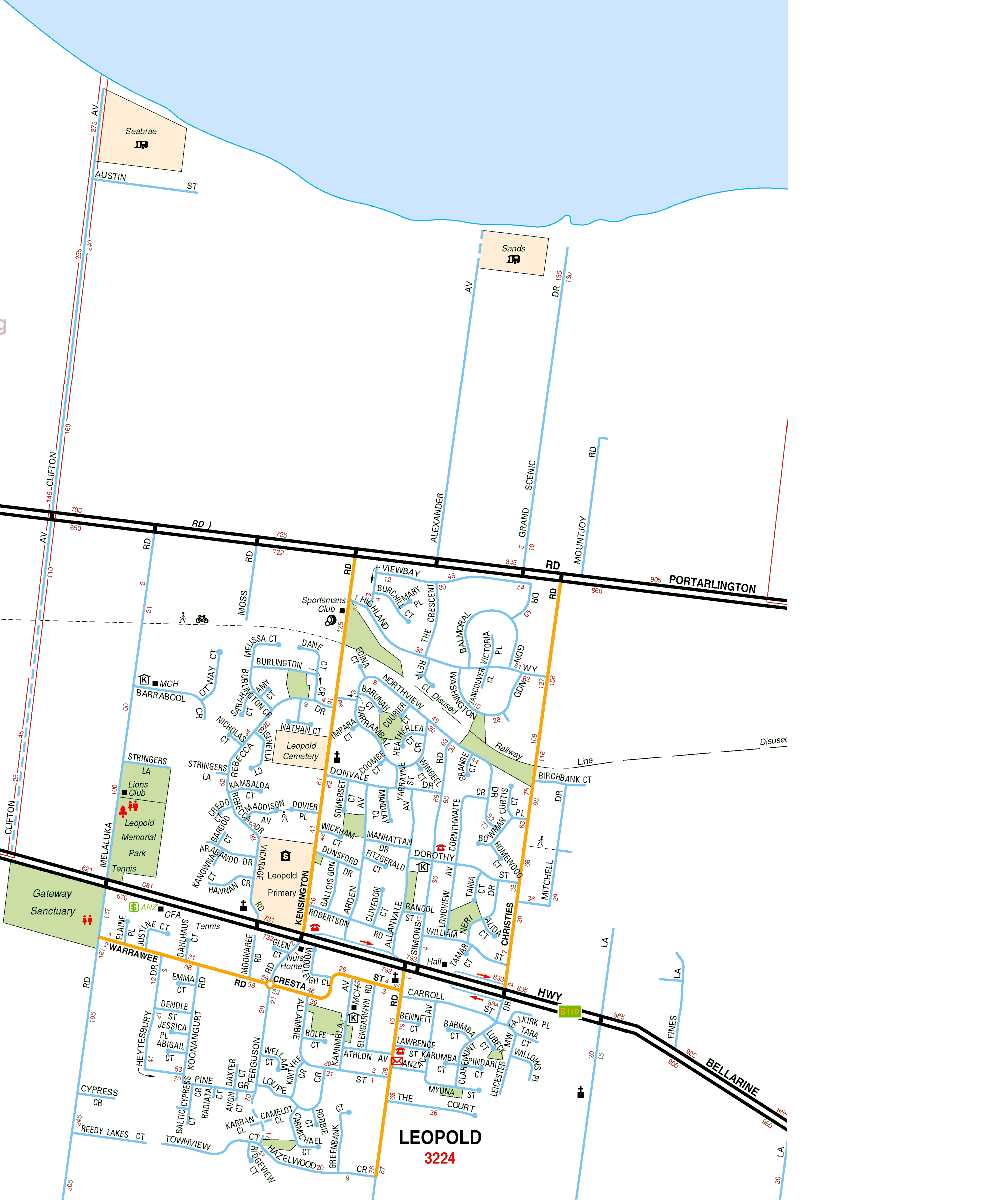 Location map - Leopold |
 Vic visible image 3.30pm |
 CSIRO image 5.38pm |
Victorian infrared image 6.30pm |
 Victorian water vapour image 6.30pm |
 Melbourne airport Skew T 10am |
Vic IR loop |
Melbourne airport Skew T 10pm
|
 Hodograph (Melb airport) - 9pm |
Hodograph (Melb airport) - 9pm In both cases the red lined wind vector is the pressure averaged wind. The value is not printed, but it's 223/31kn. The only difference in the two images is the wind profile on the left. Download the HodoTool - Java applet zip file here courtesy Hank de Wit |
 Hodograph (Melb airport) - 3pm |
Many thanks to the following individuals & organisations for these making these images & analysis available: Kevin Parkyn, Hank de Wit, Harald Richter, Robert Goler, Jane ONeill, Bureau of Meterology, Omni-net, Sandringham Yacht Club, coastalwatch.com, Unisys, CSIRO Marine Research, University of Wisconsin, United States Navy Web Information Service. |
||
Back to October Forecast Outlook, Discussion and Report page